
XRP Trading Volume Shatters Records, Surges by 240% in a Single Day

In the last 24 hours, XRP’s trading volume has experienced a remarkable 240.21% surge, reaching $1.84 billion. This surge in trading activity occurred during a time of increased market volatility, where XRP’s price increased by 0.87%.
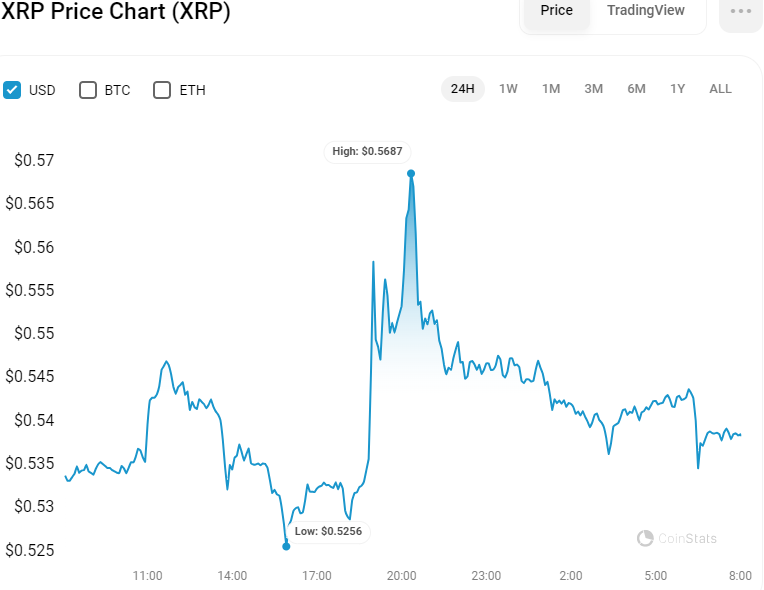
XRP/USD 24-Hour Chart (Source: CoinStats)
Read Also: Breaking News: Whales Move 28M XRP as Ripple vs SEC Deadline Nears
This turbulence is closely linked to the ongoing legal battle between Ripple, the organization behind XRP, and the U.S. Securities and Exchange Commission (SEC). Today is a crucial deadline for the SEC to respond to Ripple’s proposed solutions to their ongoing legal dispute.
Despite the price fluctuations, XRP’s market capitalization remains stable and has increased by 0.78% in a day to reach $29.7 billion. This indicates a ratio of trading volume to market capitalization of 6.19%, which suggests that while trading activity is high, it is consistent with past trends during times of market uncertainty.
XRP has shown bullish momentum since the beginning of the month, with a 19.12% increase, as indicated on the 4-hour chart. However, after reaching resistance near $0.57, the price started to correct, aiming to retest the 50% Fibonacci level for support.
XRP’s Technical Challenges: A Closer Look
If the 50% Fibonacci level holds, XRP’s price could stage another bullish rally, potentially surpassing the $0.57 resistance area. On the other hand, if the 50% Fibonacci level is breached, the XRP price may slide further to find support at the 38.2% Fibonacci level, which acts as a low-level safety net. A breach at this point could push XRP prices down to the March low, marking a significant pullback.
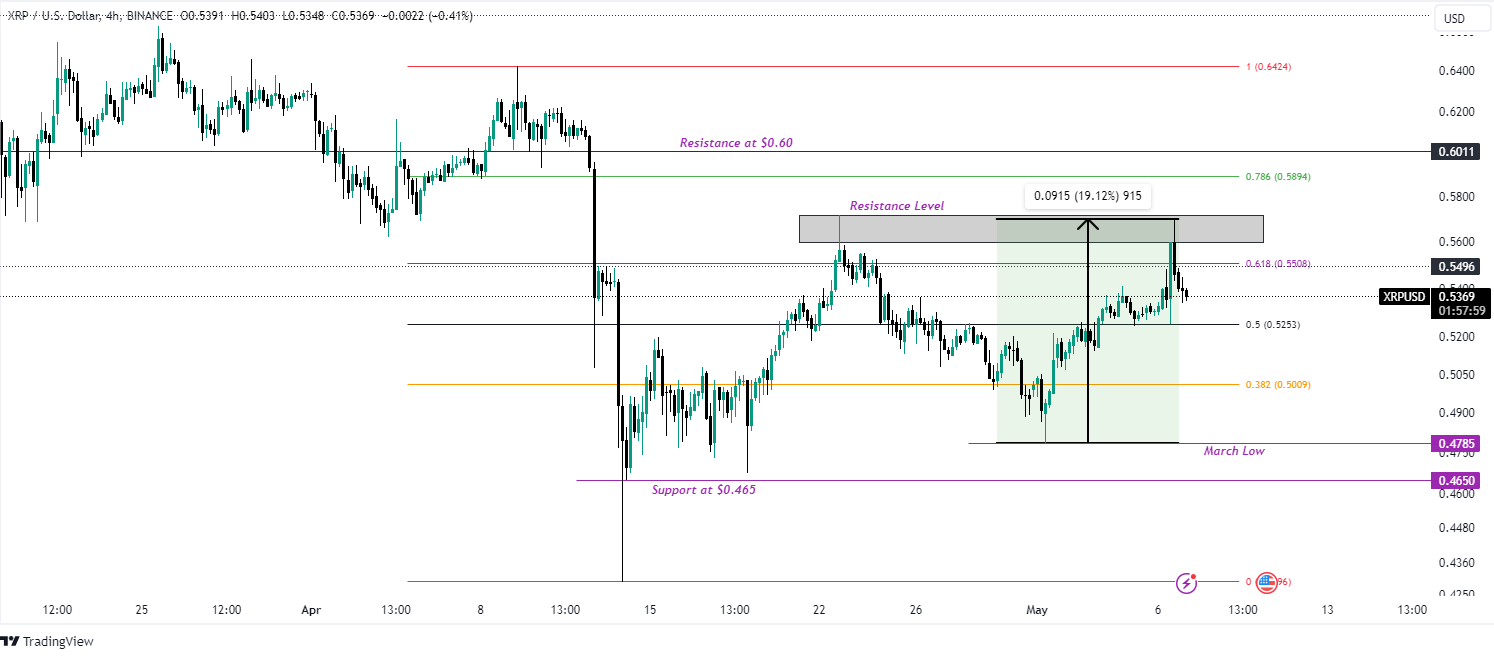
XRP/USD 4-Hour Chart (Source: Tradingview)
On the technical side, the MACD indicator is trending downward, positioned at 0.0054, signifying a weakening bullish momentum. This could indicate a market shift where bears start to take control in the short term.
Additionally, the MACD line has subtly dipped beneath the signal line, heralding a likely downturn. The shrinking MACD histogram bars, which mirror prevailing market sentiment, edge closer to the zero thresholds, hinting at waning purchasing momentum and an imminent pivot towards selling pressure.
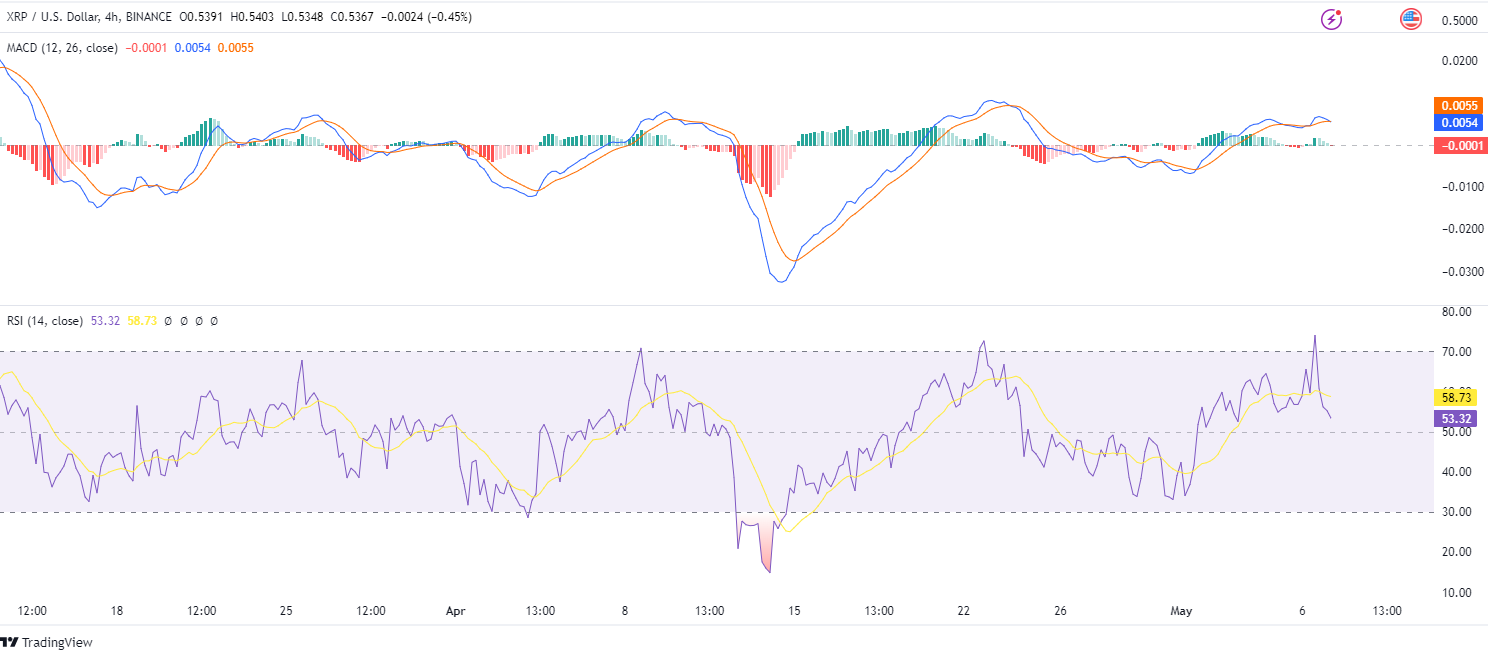
XRP/USD 4-Hour Chart (Source: Tradingview)
Read Also: Dogecoin Rises by 29% Amid Reports of Tesla Supporting DOGE Payment
In alignment with these observations, the Relative Strength Index (RSI) has departed from the overbought zone, descending in a corrective manner and signaling a prospective phase of price correction. Currently positioned at 53.32 and below the signal line, the RSI suggests a potential bearish trend as it approaches the neutral zone and continues to decline.
Follow us on Twitter, Facebook, Telegram, and Google News.

Kayode Michael is a seasoned cryptocurrency analyst, successful trader, and skilled writer with a strong command of cryptocurrency analysis and price action. He leverages his technical analysis skills to provide valuable insights into emerging market trends and potential opportunities for investors to make informed decisions.


