
Dogecoin Could Plunge to $0.10 as it Encounters Strong Resistance

Based on the recent Bitcoin rejection at the $70K mark, the overall market sentiment is in a precarious position. The meme coins, especially Dogecoin and Shiba Inu, are currently at a crossroads as they grapple with long-term patterns.
Dogecoin’s failure to overcome a key resistance level suggests a potential significant correction if the market experiences a downturn. The question arises whether the Dogecoin token price will dip below the psychologically significant $0.10 mark, or if it’s poised for a surge to $1.
Daily log chart for Dogecoin, repeated unsuccessful attempts to recover are met with strong resistance, forming a resistance trendline. While it’s holding above the psychological $0.10 mark, a falling wedge pattern is taking shape with a descending support trendline.
Read Also: Today’s Crypto Update: Bitcoin Slips to $66,000, While Altcoins Trail Behind
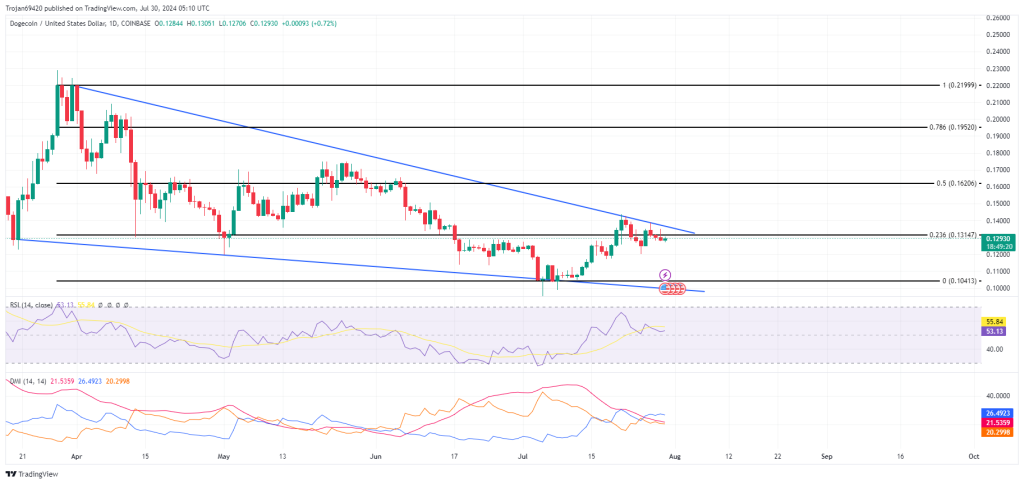
The recent struggles of Dogecoin and the looming correction point towards a possible bear cycle, particularly evident in the consecutive bearish candles with long wicks.
As of now, Dogecoin is trading at $0.12885, forming a Doji candle with a minimal 0.38% gain. The substantial supply near the trendline is likely to exert downward pressure on the $DOGE price towards the $0.10 psychological level. The bullish crossover in the VI lines and the RSI line’s position above the midpoint in the daily chart indicate favourable momentum for a bullish outlook.
Dogecoin Encountering Resistance at the Overhead Trendline
In the 4-hour chart, the ongoing bull cycle for Dogecoin is encountering resistance at the overhead trendline, forming a triangle pattern. Sustaining the trendline has become a challenge for buyers, and as the price approaches a bottleneck, the trend is likely to become clearer.
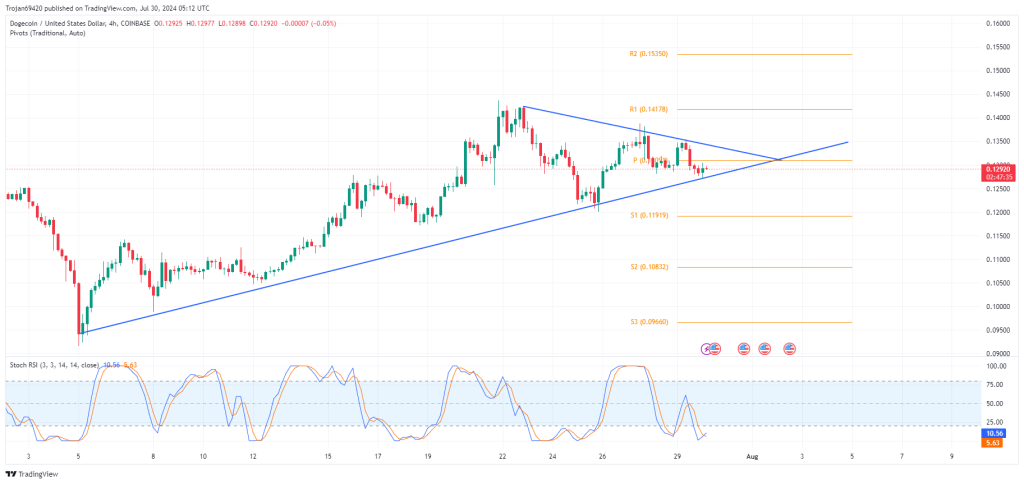
A bullish breakout could propel the altcoin to the R3 pivot point at $0.16, marking a 28% increase this week. However, falling below the trendline may lead to a dip to $0.10, with some potential for a minor reversal at the $0.11919 pivot support.
The stochastic RSI line indicates a forthcoming bull cycle, with the KD lines showing a positive crossover in the oversold zone, affirming underlying demand and the potential for a bullish revival. Dogecoin is currently positioned at a highly volatile juncture, and sharp movements are anticipated in the coming week.
According to Fibonacci levels in the daily chart, a breakout from the wedge pattern could drive Dogecoin to the 50% Fibonacci level at $0.1626. However, breaching the 4-hour support trendline could indicate a bearish trend.
Read Also: Analyst Foresee Solana Outshining Major Cryptocurrencies, Touted as the Fastest Horse of this Cycle
Follow us on Twitter, Facebook, Telegram, and Google News

Kayode Michael is a seasoned cryptocurrency analyst, successful trader, and skilled writer with a strong command of cryptocurrency analysis and price action. He leverages his technical analysis skills to provide valuable insights into emerging market trends and potential opportunities for investors to make informed decisions.


