
Analyst Predicts Shiba Inu Will Soar Past $0.001: Checkout the Anticipated Breakout Timeline
According to the analysis, a breakout from a multi-month descending trendline is expected to trigger an ambitious rally for Shiba Inu. This trendline has been constraining the coin’s significant upward movement since 2021. If the breakout occurs, Shiba Inu’s price could surge by an impressive 7,379% from its current level.
SHIB Potential Breakout
The long-term descending trendline is clearly depicted on the monthly chart, persistently exerting downward pressure on SHIB since late 2021. Following its peak at the all-time high of $0.00008854 in October 2021, Shiba Inu experienced a downturn, aligning with the broader market decline.
Afterward, the meme coin entered a consolidation phase, characterized by a series of lower highs and relatively stagnant price movement within the range of $0.000005 to $0.00003. The prolonged period of low volatility suggests the possibility of a substantial price movement in the near future.
Additionally, the chart indicates resistance formed along the descending trendline, with the forecast pointing to a breakout through this trendline between January and February 2025. Interestingly, the projected target for this breakout is at the psychological milestone of $0.001, representing a remarkable 7,379% increase from the current levels.
The analysis also notes that while Shiba Inu’s trading volume has been volatile, it has generally stabilized, and the monthly Relative Strength Index (RSI) hovers around neutral, indicating the absence of overbought or oversold conditions.
Overview of the Short Term Movement
Regarding short-term movements, Shiba Inu is currently forming a smaller symmetrical triangle on the daily chart, with prices converging subsequent to the decline from the $0.00008845 peak. This pattern suggests an impending decision point for the coin.
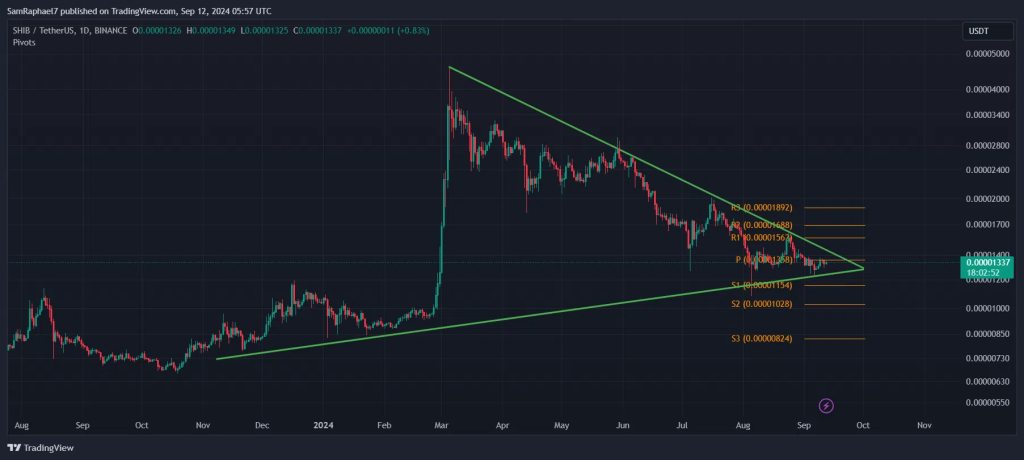
On the daily chart, the tightening price action is evident through the formation of higher lows for the support level and lower highs for the resistance level within the symmetrical triangle. This pattern signifies a stand-off between buyers and sellers, with no decisive advantage for either party. However, historically, symmetrical triangles tend to resolve in the direction of the prevailing trend, hinting at potential further downside pressure in this case.
Despite this, a break above the upper resistance of the symmetrical triangle could signal a short-term breakout for Shiba Inu. Currently, the coin is positioned around the pivot level (P) of $0.00001337, and a move beyond the first resistance (R1) at $0.00001562 may indicate the onset of bullish momentum.
However, failure to breach this resistance level could lead to a decline towards the support levels around S1 ($0.00001154) and S2 ($0.00001028), with the critical area of $0.000015 becoming a focal point for monitoring potential developments.
Read Also: Solana Wallet Withdraws Over 177,693 SOL Tokens Worth $23M Amid Market Turbulence
Follow us on Twitter, Facebook, Telegram, and Google News

Kayode Michael is a seasoned cryptocurrency analyst, successful trader, and skilled writer with a strong command of cryptocurrency analysis and price action. He leverages his technical analysis skills to provide valuable insights into emerging market trends and potential opportunities for investors to make informed decisions.


