
XRP Faces Bearish Market Correction, but Analysts Predict Potential Surge Above $0.69
Amid an ongoing market-wide correction, XRP, the cryptocurrency associated with Ripple, has experienced a decline below the $0.47 price mark. Despite its bearish situation, crypto analysts believe that a breakout could lead to a surge above $0.69. Notably, CoinsKid, a prominent chartist, has emphasized the significance of a downward trendline on the XRP chart in his recent analysis.
Read Also: XRP Price Targets and Growth Potential Outlined by Prominent Influencers and Analysts
#xrp – Daily
I think if we see #xrp take out that white line on the daily, it runs to 0.69 at a minimal. pic.twitter.com/G9KtEPJ8oc
— CoinsKid (@Coins_Kid) July 6, 2023
XRP’s Struggle Against the Downtrend
Throughout the year, XRP has consistently traded below a multi-month downtrend line, indicating bearish market sentiment. However, during the March rally, the cryptocurrency attempted to break above this trendline, resulting in a high of $0.5850 on March 29. Unfortunately, the resistance from bears caused XRP to drop back to previous lows, reaching $0.4100 on May 8.
Bullish Factors and Market Activity
Despite the downtrend, bullish updates and speculation surrounding the Ripple vs. SEC lawsuit triggered increased market activity. The anticipation of the release of documents related to former SEC official William Hinman’s statements resulted in high address activity and an accumulation spree among investors. As a result, XRP spiked to $0.5658 on June 13, briefly touching the trendline before experiencing a rapid decline.
CoinsKid’s Analysis and Price Target
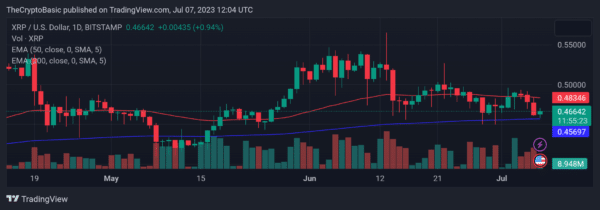
CoinsKid, while examining the XRP chart on the daily timeframe, suggested that a successful breakout above the downtrend line could lead to a potential rally to $0.69. He emphasized that this target represents the “minimal” price projection, indicating the possibility of further gains. Notably, achieving this price level would signify a 48% increase from XRP’s current price.
50-Day Exponential Moving Average (EMA)
On the daily chart, XRP has remained below the 50-day exponential moving average (EMA), currently valued at $0.4834. However, recent market developments saw XRP breaking above the 50-day EMA, reaching a high of $0.4841. This movement indicates a potential shift in momentum, providing some optimism for XRP traders.
Despite XRP’s struggles in the face of a market-wide correction, there are signs of potential upward movement. Analysts, such as CoinsKid, have identified a significant downtrend line on the XRP chart, suggesting that a breakout above it could lead to a rally toward $0.69. However, it is important to note that the cryptocurrency market is highly volatile, and prices are subject to change based on various factors. Traders and investors should exercise caution and conduct thorough research before making any financial decisions.
Follow us on Twitter, Facebook, Telegram, and Google News.

Dr. Olajide Samuel juggles the demands of medical studies with a passion for cryptocurrency. A seasoned blogger, Olajide shares his vast global knowledge of the crypto space, offering insights to enthusiasts. Despite his busy schedule, his commitment to crypto remains strong, and he actively seeks ways to contribute to its future.


