
Uniswap Pulls Back After Reaching $9.68 High: Can it Still Hit $10.50?

Uniswap saw a decrease of almost 3% on Tuesday, losing momentum. A bearish trendline near the high of $9.68 caused the price to face resistance. Despite this, the momentum oscillator still shows a bullish bias for the token.
Despite starting the week positively, Uniswap couldn’t sustain its gains on Tuesday, leading to negative sentiment as the price dropped below $9.40.
Read Also: Dogecoin(DOGE) Whales Spark Market Alarm with an 86% Drop in Critical Trading Metric
Currently, the crypto market sentiment is mixed. Uniswap is currently being traded at $9.37, marking a 3.78% decrease for the day. According to CoinMarketCap, the 24-hour trading volume has fallen to $295,461,965.
Uniswap is trading close to the critical level around $9.40, which previously acted as a support zone. Additionally, breaching the bearish trendline could strengthen the likelihood of a sustained upside breakout. If this occurs, the initial upside target could be near the horizontal resistance zone at $11.43, followed by the high of March 31 at $13.33.
Uniswap Struggles to Break Bearish Trendline
On the daily technical chart, the bullish trend is facing difficulty in surpassing the bearish trendline, which originated from the high of $17.33 on March 6. After a strong performance on Monday, the price entered a period of consolidation over the past two sessions but still maintains an upward trajectory.
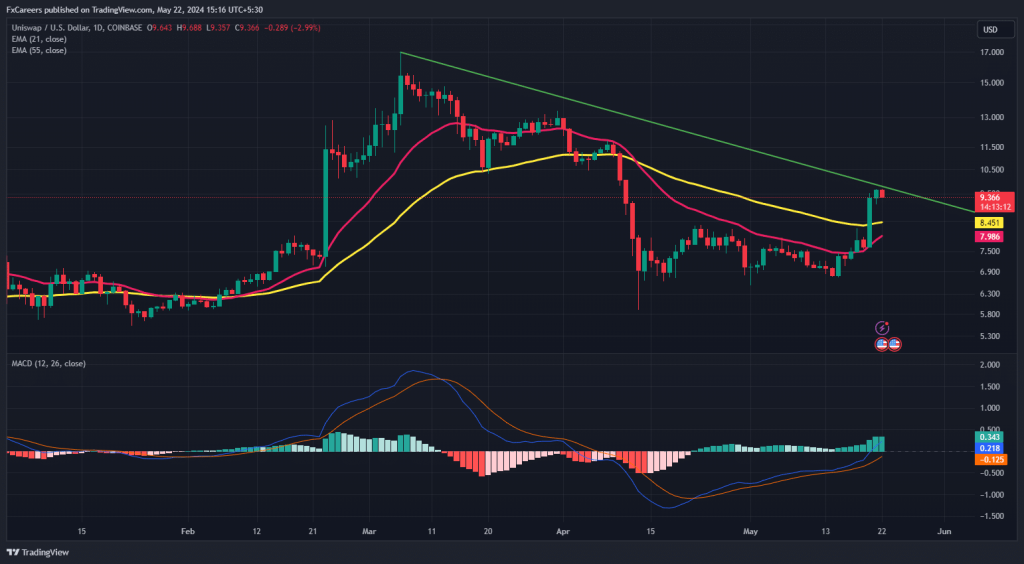
Following the crossover of the 21-day EMA and 55-day EMA on April 12, there was a significant downturn, with the price correcting by 50%. Subsequently, UNI entered a short-term consolidation phase between $6.55 and $8.13. On Monday, the bulls managed to break above this level.
The bullish view is supported by the Moving Average Convergence Divergence (MACD) indicator, which is trading above the central line with bullish momentum. Additionally, Uniswap is maintaining levels above the two moving averages.
Currently, the token is trading close to the critical level around $9.40, which previously acted as a support zone. Additionally, breaching the bearish trendline could strengthen the likelihood of a sustained upside breakout. If this occurs, the initial upside target could be near the horizontal resistance zone at $11.43, followed by the high of March 31 at $13.33.
On the daily technical chart, the bullish trend is facing difficulty in surpassing the bearish trendline, which originated from the high of $17.33 on March 6. After a strong performance on Monday, the price entered a period of consolidation over the past two sessions but still maintains an upward trajectory.
Following the crossover of the 21-day EMA and 55-day EMA on April 12, there was a significant downturn, with the price correcting by 50%. Subsequently, UNI entered a short-term consolidation phase between $6.55 and $8.13. On Monday, the bulls managed to break above this level.
Read Also: Shiba Inu Burn Rate Skyrockets Despite Stagnant Price
Furthermore, if sentiment shifts to bearish, it could result in further downside for the token. The initial support level is at the 55-day EMA at $8.54. If selling pressure intensifies, the low of the candlestick from Monday could be tested at $7.62.
Follow us on Twitter, Facebook, Telegram, and Google News

Meet Daniel Abang: Crypto guru, content creator, and analyst. With a deep understanding of blockchain, he simplifies complex concepts, guiding audiences through the ever-changing crypto landscape. Trusted for his insightful analysis, Daniel is the go-to source for staying informed and empowered in the world of cryptocurrency.


