
Solana’s Active Address Drop Amid Market Volatility: What is Happening?

In the last 48 hours, the market has seen high levels of volatility, impacting both Bitcoin and the altcoin market. Solana, in particular, has been significantly affected, resulting in notable liquidations. This has led to an intense battle between buyers and sellers, with on-chain metrics for Solana indicating a prevailing advantage for the bears.
SOL Active Address Decline
Over the past day, SOL has shown substantial price fluctuations near the $140 mark. Data from Coinglass reveals that total liquidations for Solana have surpassed $21 million, with long positions contributing $15 million to this figure. Additionally, Solana’s trading volume has surged by 90%, reaching $3.5 billion in just a single day.
Read Also: Cardano’s Chang Hard Fork: Anticipation Builds, But Will History Repeat for ADA?
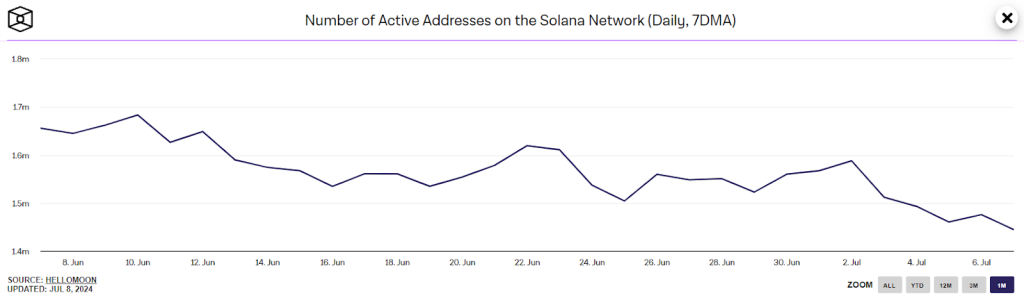
Despite the heightened trading activity, various on-chain indicators are pointing towards bearish trends. The number of active addresses has shown a downward trend, dropping from a weekly high of 1.59 million to a recent low of 1.44 million. This decline could potentially lead to a sharp fall in the price chart in the near future. Moreover, the value moved on-chain has decreased by billions in recent weeks.
A potential catalyst for Solana’s value could stem from the approval of a spot Ethereum ETF, which is anticipated to happen in the near future. Analysts predict that approval could lead to significant capital inflows into these funds, much like what occurred with Bitcoin earlier in the year.
Market Trend and Next Line of Action
Following this development, attention may shift to spot Solana ETFs, with VanEck already submitting its application for a Solana ETF. It is expected that other firms such as Blackrock, Franklin Templeton, and Ark Invest will also seek approval for their respective Solana funds.
Looking ahead, Solana is currently shaping a bearish descending triangle pattern, which will be confirmed if the price breaks and closes below $118. However, there is strong defense from the bulls against a decline below the immediate Fib channels. Currently, the SOL price is trading at $137, reflecting a decrease of over 0.7% in the last 24 hours.
Technical Analysis
On a positive note, the RSI indicates a potential positive divergence, suggesting a decline in selling pressure. If the bulls manage to drive the price above the 20-day EMA, the SOL/USDT pair could rally towards the 50-day SMA ($153) and then aim for the downtrend line.
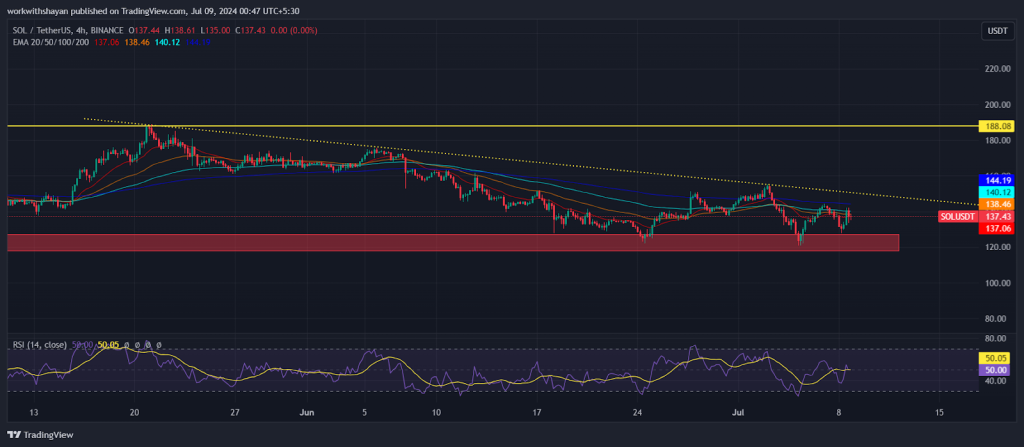
A breakout above the trend line could propel the price towards a retest of $188. Conversely, a decline from the 20-day EMA and a drop below $118 would confirm the bearish pattern, potentially leading to a downward movement to $80.
The impressive rebound from $121 underscores the active defense of the $118 support level by the bulls. A rebound from the current level and a climb above $150 could spark a surge in buying demand.
Read Also: XRP on the Cusp of a Bullish Breakout? Analyst Points to Technical Indicators
Follow us on Twitter, Facebook, Telegram, and Google News

Kayode Michael is a seasoned cryptocurrency analyst, successful trader, and skilled writer with a strong command of cryptocurrency analysis and price action. He leverages his technical analysis skills to provide valuable insights into emerging market trends and potential opportunities for investors to make informed decisions.


